A, B or C?
I am in my 50s - should I invest into SPY or a diversified portfolio?

Last week we used our crystal ball - the Monte Carlo simulation - to understand what we can expect from a SPY investment savings plan. We do not need to worry about Mo! He will be a millionaire with a 90% probability if he sticks to his saving plan!
This week someone raised the following question:
I know that a SPY savings plan is powerful for someone in their 20s. But what if I am in my 50s, with $100,000 in savings and I can save an additional $1,000 a month. Should I also invest in SPY or something else, like a diversified portfolio?
This is a great question. You might have heard: "Don't put all your eggs into one basket", "Equity investments are risky!" or "I prefer bonds, because they pay a regular coupon."
Let's use the following situation: Our investor is 50 years old, has $100,000 of savings and every month can save $1,000. Now we want to know what he can expect in 10 years when he turns 60.
A, B or C?
Let's look at three possible portfolios:
A) invest 100% of your current and monthly savings in SPY or
B) invest in into a portfolio of equity and bond ETFs, or
C) invest in into a portfolio of only bond ETFs

Let's look at the backtest for these three portfolios. We start with $100,000 and save $1,000 every month.

This chart shows how the portfolios developed since 2008 until 2024. Looking at the values in September 2024 the clear winner is portfolio A (SPY) with $1.3 million, followed by portfolio B (equity/bonds) with $740,000 and portfolio C (bonds) with $450,000.
But the portfolio A (SPY) was not always the leader! Look at February 2009. The pure bond portfolio C is clearly celebrating his pole position when the equity markets experienced a dramatic hit in the 2009 credit crisis. It was in 2013 where the portfolio A (SPY) and portfolio B (equity/bond) recovered and overtook the pure bond portfolio C.
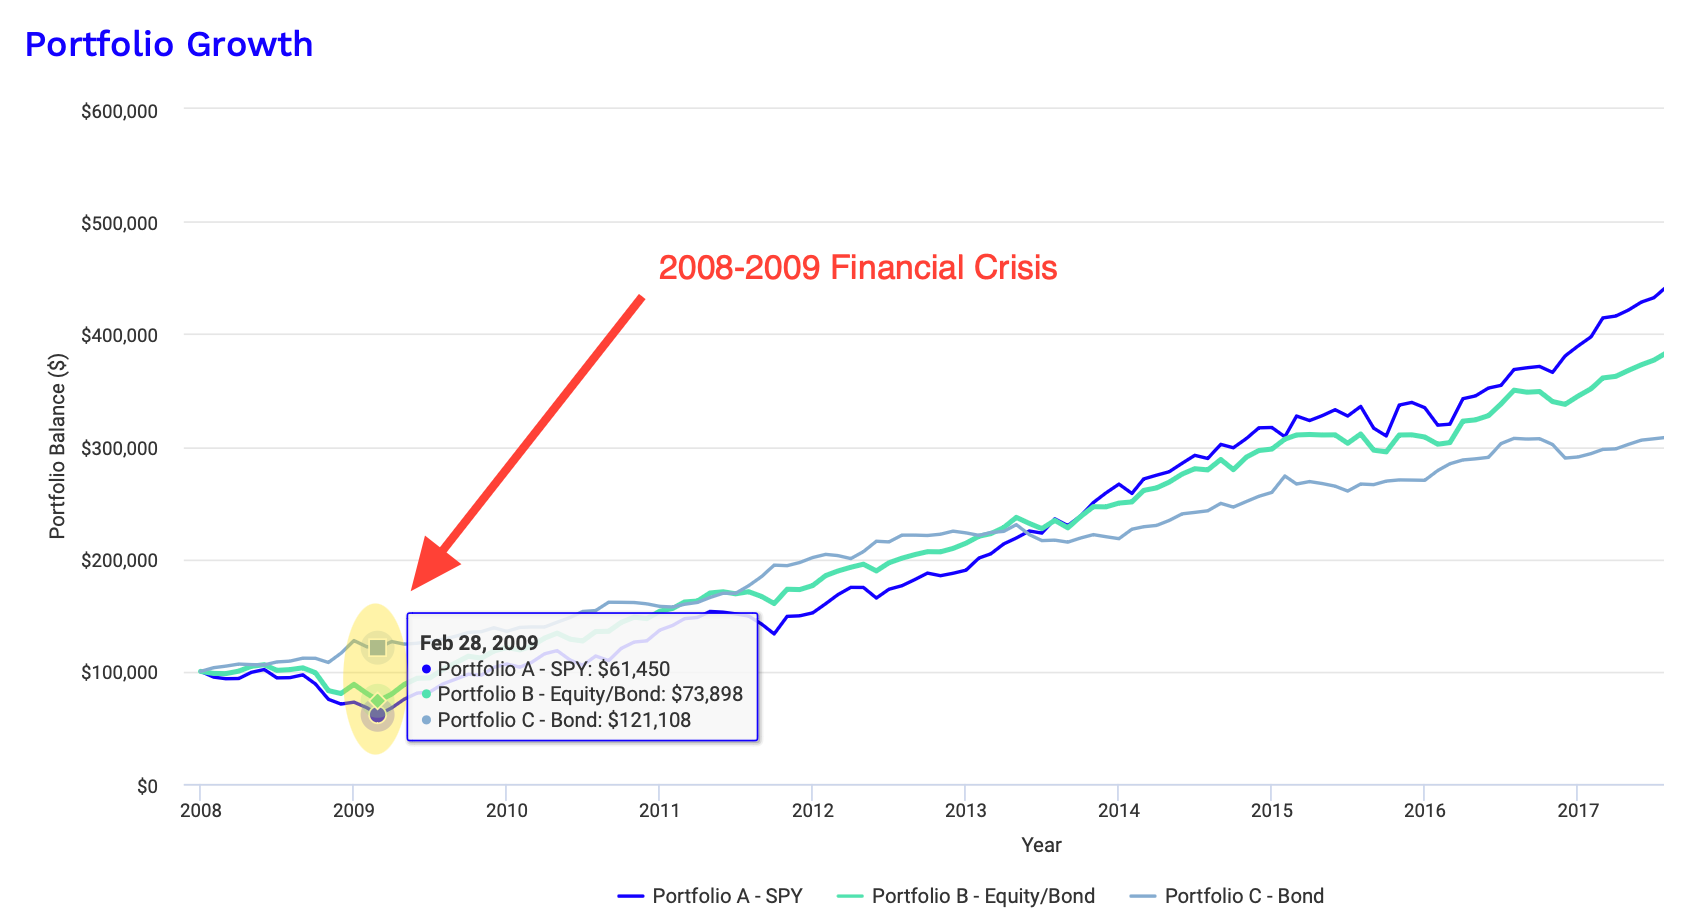
History is telling us a valuable lesson here. But what about the future?
This is where the Monte Carlo simulation comes in - our financial crystal ball. We take all the historical price and volatility data from our investments and create 10,000 simulations for the SPY and the other ETFs over the next 10 years.
What does the Monte Carlo simulation do?
Nerd alert!

This is a bit technical! But let me give you a word of encouragement. The times where you can say "this is too complicated" are over. We are in 2024 and we have AI. Asking the right questions is more important today than ever.
Asking ChatGPT for a Monte Carlo simulation, we get all the explanation we need and even python code which we could run on our computer if we want to. It's 30 lines of code and if you want I can share a Jupyter notebook with you how to set this up. I am not a computer geek, but with ChartGPT and python I was able to do it. So are you! However I have done that for you. Here is the SPY price simulation for the next 10 years:

Remember that's a simulation based on historical parameters, not a prediction. We know historical prices are important and they display certain characteristics which are relevant in the future. In general a Monte Carlo simulation can be better than looking at one single backtest. The likelihood that history repeats itself exactly is almost zero, but it might repeat itself like the Star Wars sequels. It's always a different story but you can rely on the characters. You find R2-D2 in every of the nine Star Wars films.
The results are in!
Here is the performance summary of our simulations with various portfolio end balances in 10 years with probabilities.
Portfolio A - 100% SPY
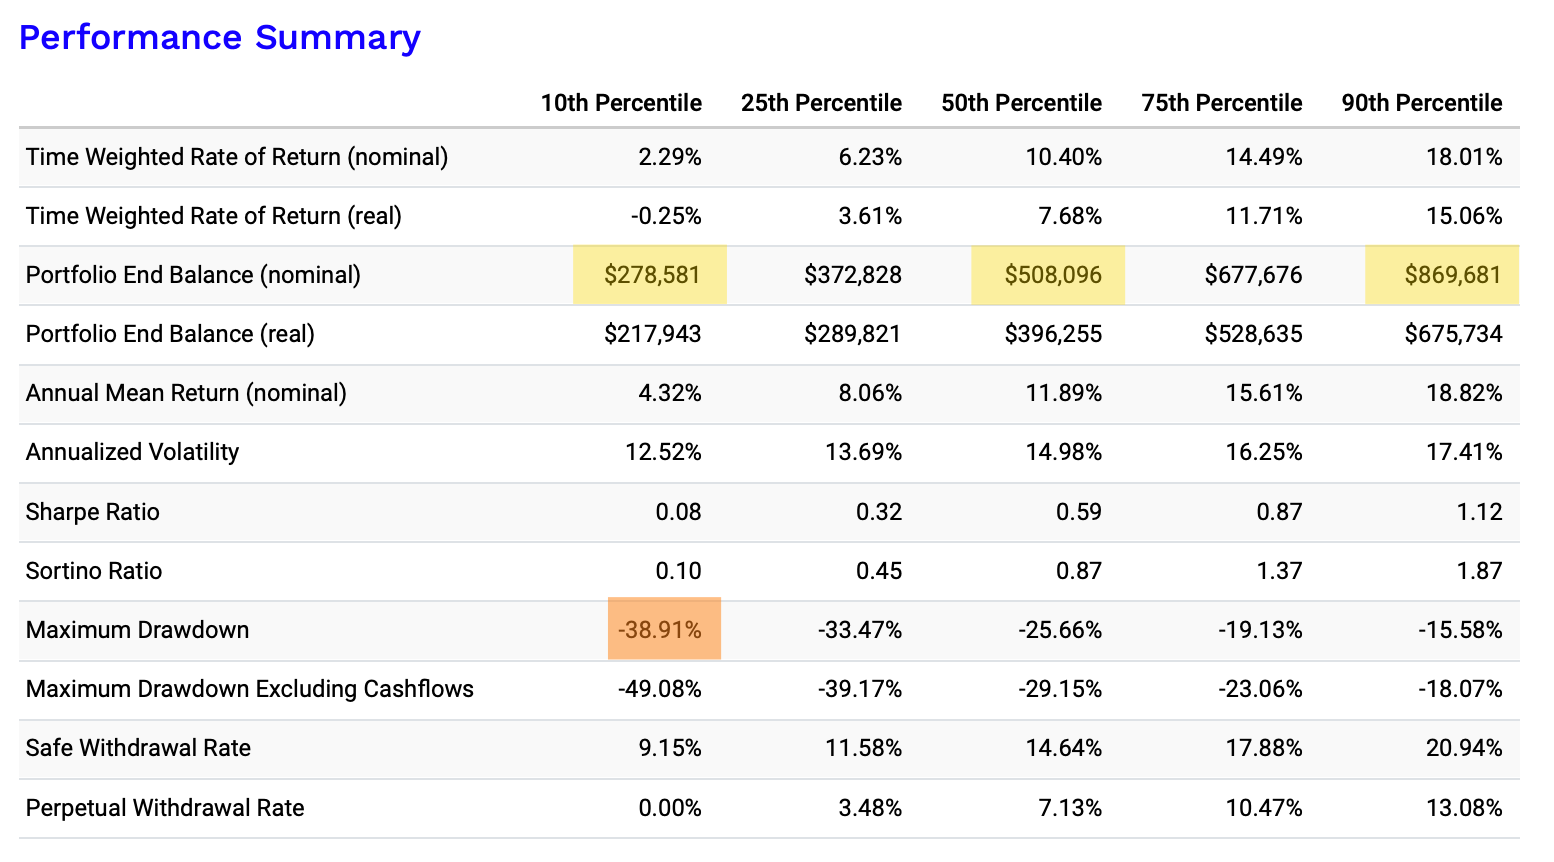
How to read these results? What are these percentiles? Looking at the the highlighted values we can say:
Investing $100,000 today and than every month $1,000 into SPY, there is a chance of ...
- 10% that the portfolio value will be $275,000 or lower
- 50% (or a median scenario) that the portfolio will end up around $500,000
- 10% chance that the portfolio value will be $850,000 or higher
- 80% chance that the portfolio will be between $275,000 and $850,000
- 10% chance of a portfolio value drop greater than 38%
Portfolio B - Equity/Bond
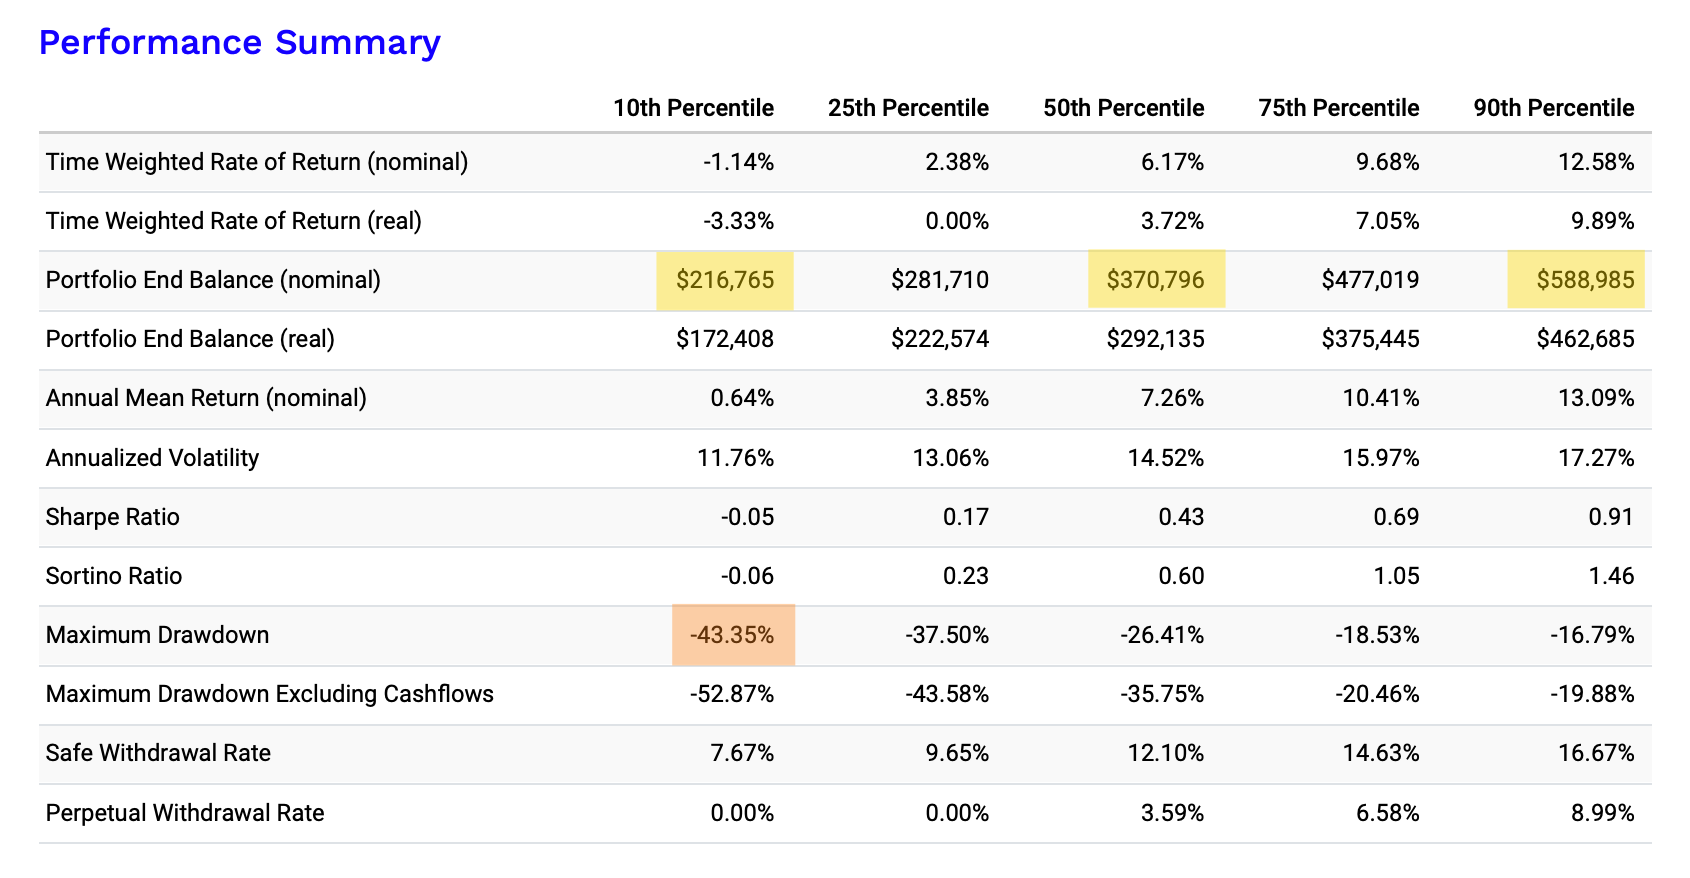
Investing $100,000 today and than every month $1,000 into portfolio B (equity/bond), there is a chance of ...
- 10% that the portfolio value will be $215,000 or lower
- 50% (or a median scenario) that the portfolio will end up around $370,000
- 10% chance that the portfolio value will be $590,000 or higher
- 80% chance that the portfolio will be between $215,000 and $590,000
- 10% chance of a portfolio value drop greater than 43%
Portfolio C - 100% Bonds
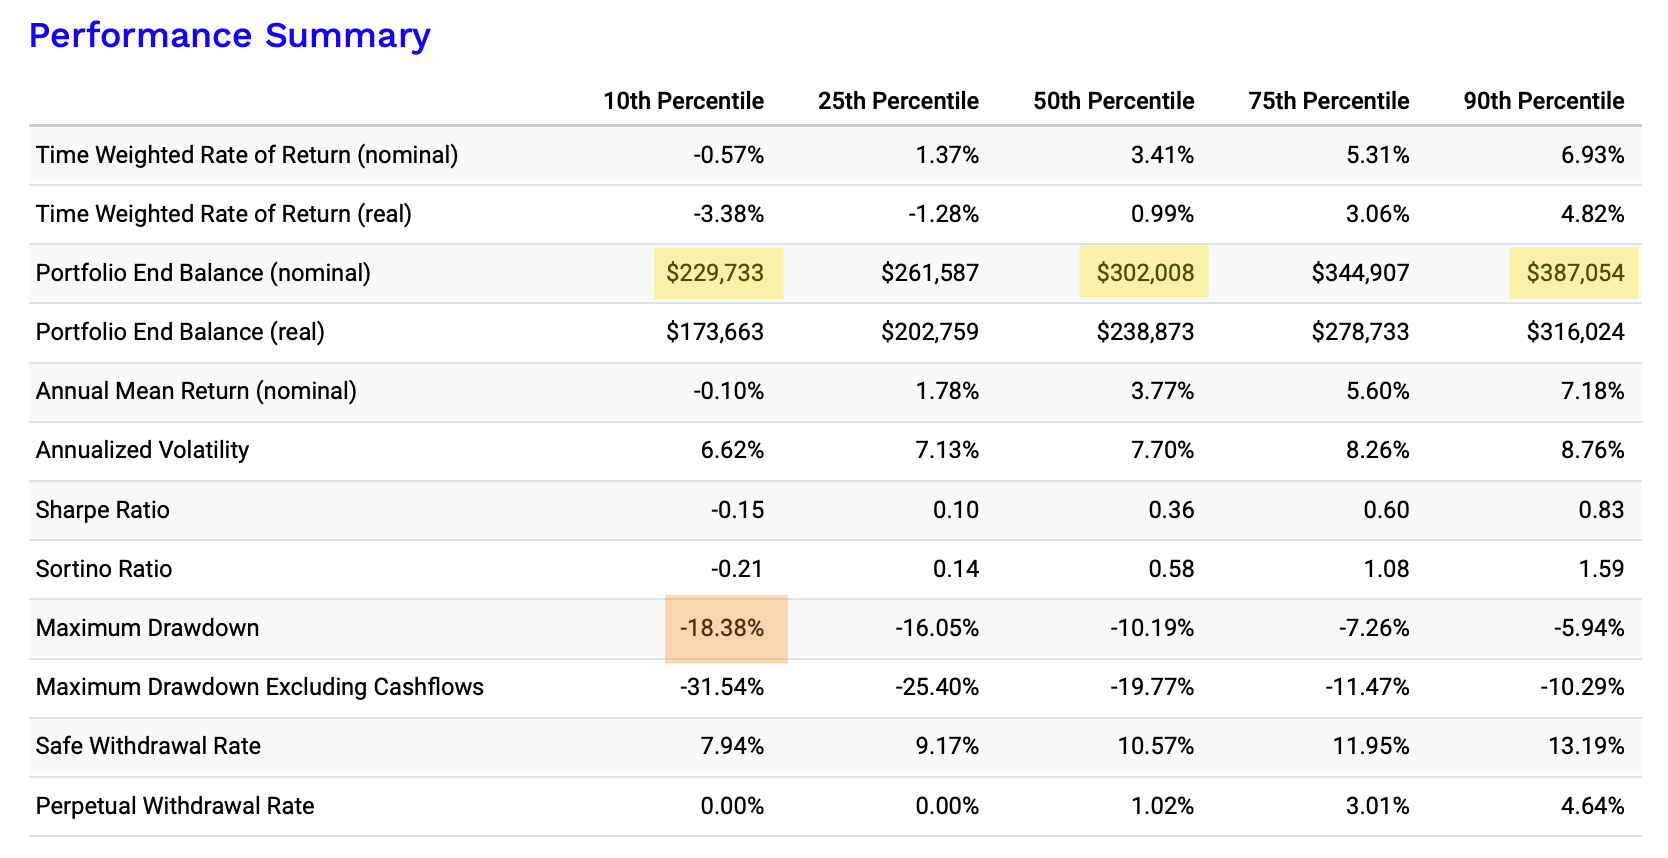
Investing $100,000 today and than every month $1,000 into portfolio C (bond), there is a chance of ...
- 10% that the portfolio value will be $230,000 or lower
- 50% (or a median scenario) that the portfolio will end up around $300,000
- 10% chance that the portfolio value will be $390,000 or higher
- 80% chance that the portfolio will be between $230,000 and $390,000
- 10% chance of a portfolio value drop greater than 18%
Conclusion
Should someone with an investment horizon of 10 years be fully invested in SPY?

Looking at the expected portfolio values, I think portfolio A (SPY) looks very attractive. But you need to accept that it might be a rocky road, because there is a 10% chance you see in portfolio A (SPY) a drop greater that 38% compared to only 18% in portfolio C (bonds).
If you want to have a chance for more that $850,000 in 10 years, you have to go with portfolio A but if you want the lowest chance of a high value drop portfolio C is your friend.

A, B or C? What would you choose? Comment below.