How Much Risk Is Too Much for Me?
Monte Carlo simulations help evaluate investment risk by modeling outcomes and identifying the “Risk Floor" a kind of worst-case scenario. Translating volatility into dollar amounts lets investors visualize potential downside and make informed decisions aligned with their personal risk tolerance.

In this post, we’ll explore an intuitive yet powerful way to calculate investment risk using a technique we introduced in Who Wants to Be a Millionaire? – called Monte Carlo simulation.
Let’s take a practical example: You’ve got $10,000 to invest and are considering a particular investment. Now you want to understand your potential risk over the next 12 months and ask yourself: “What’s the kind of result I might expect if things go really poorly, but not catastrophically?” A Monte Carlo Simulation is a great tool for this.
What Is a Monte Carlo Simulation?
The Monte Carlo simulation isn’t as fancy as it sounds. It’s a technique to model uncertainty by running thousands of hypothetical scenarios based on historical data or assumed inputs. Each scenario represents one possible outcome for your investment’s performance. By collecting all these scenarios, we can estimate a range of potential outcomes.
Imagine rolling a dice thousands of times. You know the possible outcomes range from 1 to 6, but you don’t know which number will come up next. Monte Carlo simulation works similarly, except instead of dice, we’re modeling stock price movements. Each "roll" represents a potential day in the market, and by aggregating thousands of these scenarios, we can estimate the range of possible outcomes for an investment.
Defining the Worst-Case Outcome
In the world of Monte Carlo simulations, this is often referred to as the "2.5% percentile," but let’s simplify it and call it the "Risk Floor." This represents a practical way to think about the worst-case result for your investment without getting bogged down in technical terms or statistics.
For example, if you invest $10,000 and the Risk Floor after 1 year is $7,000, it means there’s only about a 2.5% chance your investment will drop below $7,000. It’s not a guarantee, but it’s a highly informative estimate.
Simulating the Future: A $10,000 Example
We developed a simplified Monte Carlo Simulation app for you which calculates the Risk Floor. Let's use this to visualize this concept. Here’s how it works:
- Inputs: We start with a $10,000 initial investment and assume two alternative investments, A and B. For the annualized volatility (a measure of risk), we’ll use:
- Volatility for Asset A: 20% (moderate risk)
- Volatility for Asset B: 50% (higher risk)
- Time Horizon: 1 year
- Simulation Frequency: Daily (252 trading days per year)
- Paths: The simulation generates thousands of potential price paths for your investment by modeling daily price changes. Each day’s change is influenced by volatility, with a sprinkle of randomness to mimic real-life uncertainty.
- Outcome: After 10,000 simulations, we’ll look at the distribution of ending prices. The Risk Floor will guide us on the worst-case outcomes.

The Risk Floor (dotted line) shows that in a bad year, your $10,000 investment in Asset A (blue line) could drop to around $6,900 (-31%). But if you invest in Asset B (red line) with a 50% volatility, you have to accept that in a bad year, your $10,000 could end up at around $3,500 (-65%).
We’ve translated the volatility into a dollar amount—something much easier to understand. Now you can ask yourself if you’re "okay" with this level of risk. Remember, taking on risk is essential to earning returns, but this method helps you calculate exactly how much risk we’re talking about in dollars.
Where to Find Volatility Data
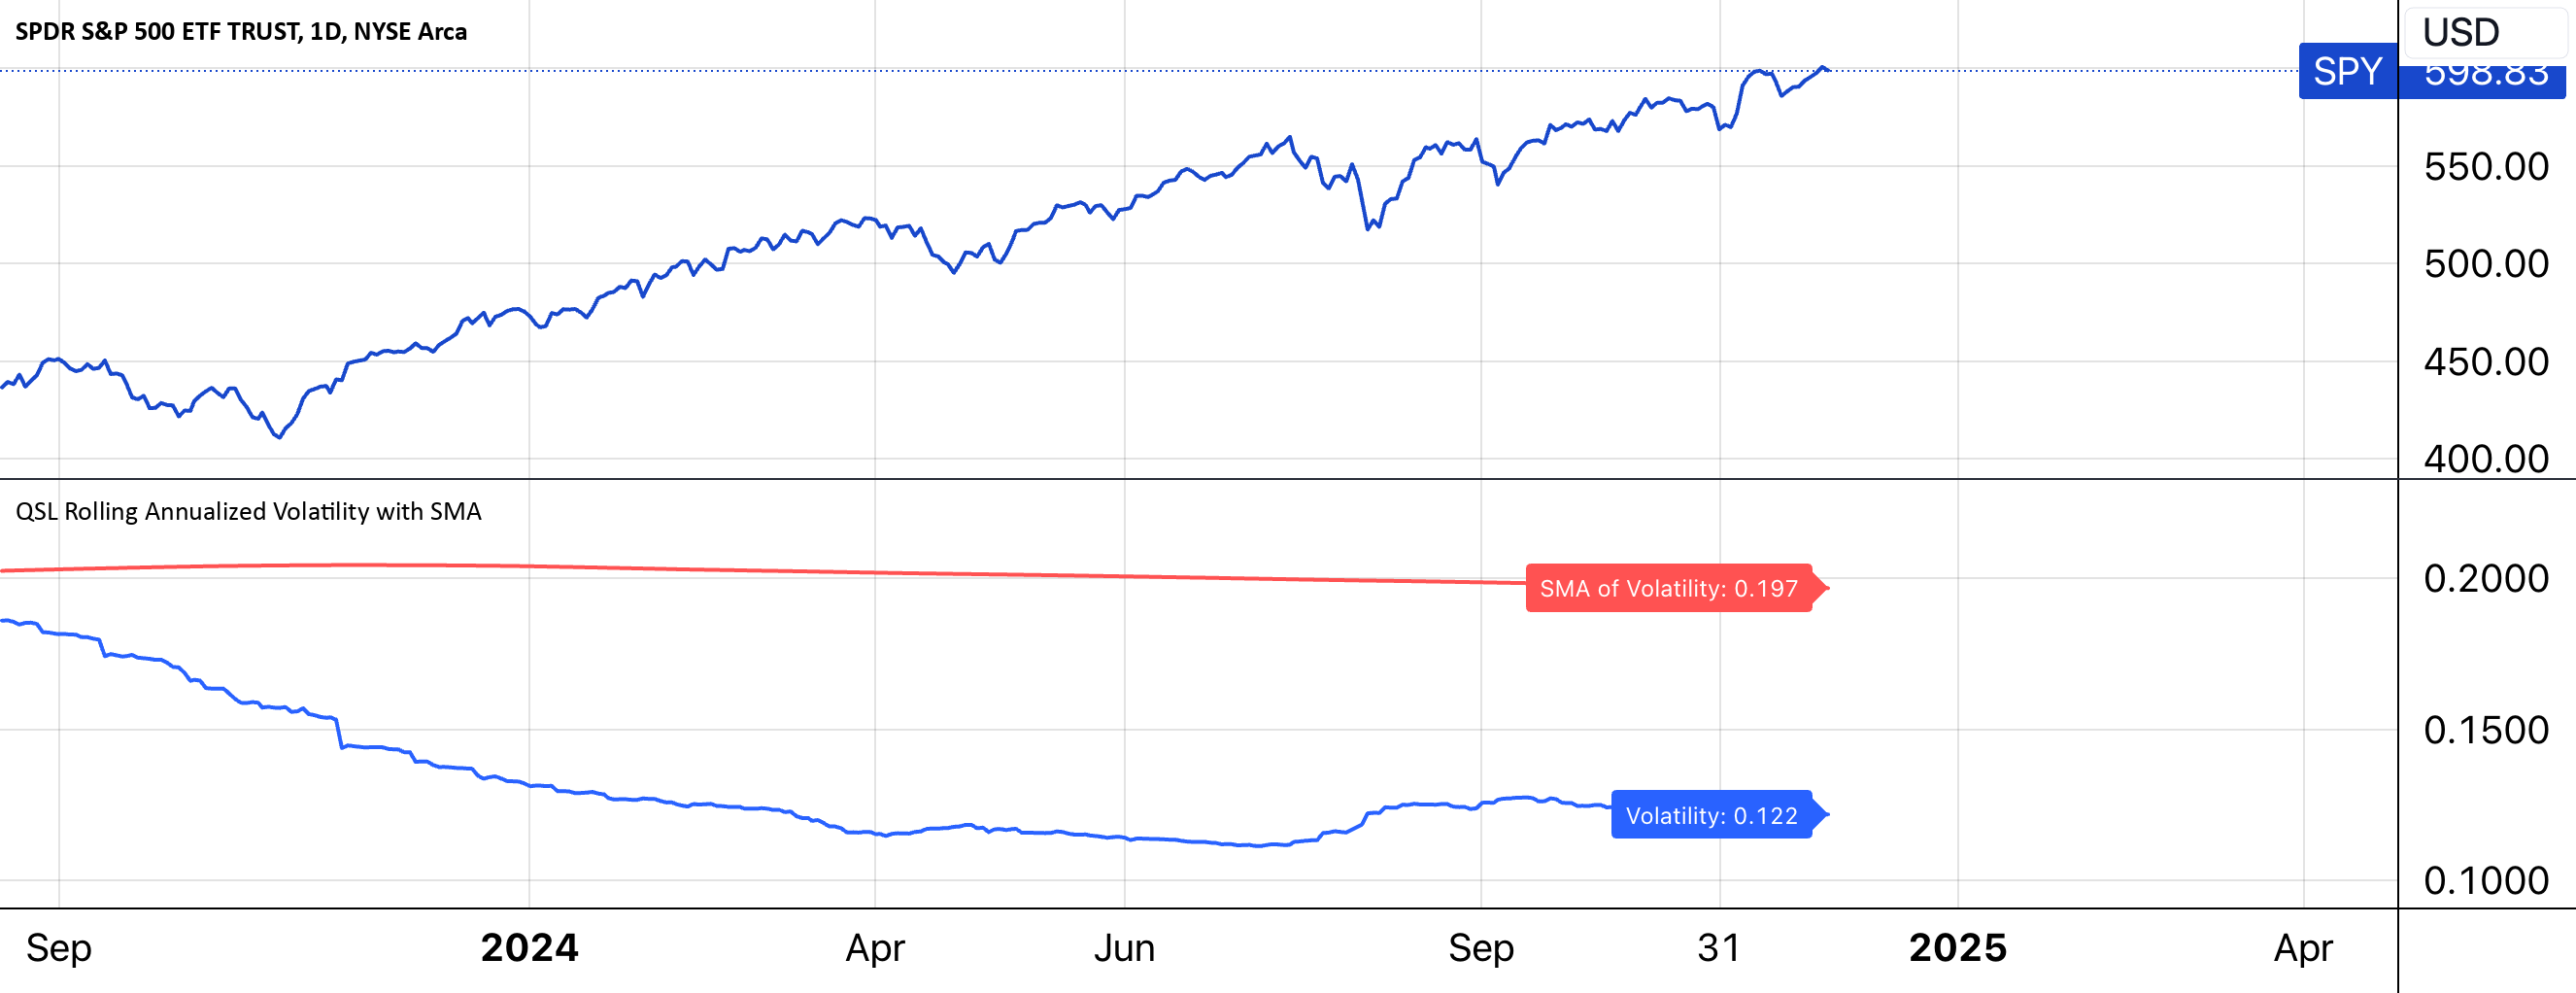
Before you can run a Monte Carlo simulation, you need to know the volatility of the investment you’re considering. One easy way to find this data is through platforms like TradingView. We created an indicator for you that shows the historical volatility for any stock or ETF you might consider investing in.
You can copy it by clicking on the link below and selecting "Add to Favorites." That way, you’ll have it in your TradingView account and can add it to your chart anytime you want:

This script calculates and plots the rolling annualized volatility of an asset’s returns and its simple moving average (SMA) over customizable time periods. Starting with daily returns it compute rolling standard deviations, annualizes the results, and overlays both the volatility and its SMA on a chart for visualization. Labels display the most recent values of both metrics for easy reference.
The indicator plots the 12-month rolling volatility in blue and a 5-year average of this value in red. For the purpose of our Monte Carlo Simulation, you can pick either value. If you want to be more conservative, choose the higher of the two.
SPY versus Tesla
Let’s use our new tools and compare SPY with Tesla:
- SPY Volatility: 21% (we use the higher value)
- Tesla Volatility: 66% (we use the higher value)


After running the simulations, we see that in a worst-case scenario, the potential drop in investment could be from $10,000 t0:
- SPY Risk Floor (1 Year): $6,700
- Tesla Risk Floor (1 Year): $2,300

That’s quite a big difference. Clearly, with Tesla, you’d hope for much higher returns, right? Absolutely. But in this exercise, we’re focusing on the risk, not the reward. This kind of visualization helps you decide: How much risk is too much for me?
The "Human Factor" in Risk
Numbers are great, but they don’t tell the whole story. Your personal risk tolerance plays a huge role. Ask yourself:
- Can I sleep at night knowing my $10,000 might drop to $3,000 or lower?
- Do I have the emotional fortitude to hold on during a downturn?
- What’s my investment goal? Am I chasing growth, or preserving wealth?
Remember, risk tolerance isn’t just about numbers—it’s also about emotions, goals, and life circumstances.
Using the App as a Tool
The Monte Carlo simulation app makes this concept interactive and engaging.
Access your Monte Carlo Risk Floor Simulator here
Here’s how you can use it:
- Adjust the Volatility Slider: See how different levels of volatility affect the Risk Floor.
- Compare Two Assets: Test how two investments stack up against each other. Are you comfortable with the trade-offs?
- Plan for the Unexpected: Use the Risk Floor to stress-test your investment ideas.
The app isn’t just about numbers—it’s about making informed decisions based on your personal comfort level with risk.
Simulations Aren’t Crystal Balls
While Monte Carlo simulations are powerful, they’re not predictions. They rely on assumptions (like volatility) and historical data that may not reflect future conditions. Markets are unpredictable, and black swan events (rare, unexpected shocks) can throw even the best models off course.
Think of simulations as a flashlight in a dark room. They help you navigate, but they don’t show the entire picture.
Why This Matters to You
Risk management is the cornerstone of successful investing. By understanding worst-case scenarios, you can:
- Align your investments with your financial goals.
- Avoid emotional decision-making during market downturns.
- Build a portfolio that lets you sleep soundly at night.
Monte Carlo simulations offer a practical, visual way to grasp risk.
Final Thoughts: So, How Much Risk Is Too Much?
There’s no universal answer. Your ideal risk level depends on your financial goals, time horizon, and personality. Monte Carlo simulations won’t eliminate risk, but they provide clarity—and clarity leads to confidence.
So, grab a cup of coffee, fire up the app, and explore. The more you understand your Risk Floor, the better equipped you’ll be to make decisions that align with your unique financial journey.
