Are we facing a 'Lost Decade'?
What happens if Goldman Sachs is right and we are facing 10 years with 3% annual returns in the S&P500?

Last week David Kostin published this report. Who is he, and why does his prediction matter?” David Kostin is the chief U.S. equity strategist at Goldman Sachs (GS) and he gets paid big bucks to predict the markets. Many investors read his global strategy papers and last week he predicted an annualized nominal total return of just 3% for the S&P 500 index for the next 10 years. This made big news, because he is basically predicting a 'lost decade' for the SPY over the next 10 years!


Do not panic! These guys are 50% of the time wrong! Hold on ... does that mean they are 50% of the time right?

If you read our very first blog post Let's talk about "Buy and Hold" you know that a "lost decade" like the one from 2000 until 2010 can be a problem for 'Buy and Hold' investors. Back then the SPY did a lot of 'rollercoastering', which is a technical term for delivering a 'nothing burger' to SPY investors.

I don't want to open pandoras box and discuss if David from Goldman Sachs is correct or not? Ed Yardeni for example - a well respected economist - disagrees in his response to the Goldman report. I personally do not care who is right or wrong. I simple ask myself: "What happens if Goldman is correct?"
If you are a buy and hold investor with a 30 to 40 year investment horizon, maybe the risk of a 'lost decade' is not relevant for you.
But if you’re feeling unsure about a potential ‘Lost Decade,’ algorithmic strategies might help you to be more confident about your strategy! Why? They’re built on solid rules that a computer can follow, helping you avoid emotional decisions. They can do multiple calculations and review hundreds of stocks in no time. You can test them on past data to see how they do in different market environments, and you get built-in safety features like stop-losses to control risk. Plus, you can spread the risk by running multiple strategies simultaniouly on different stocks or ETFs.
If a ‘lost decade’ is on the horizon, let’s explore how investment strategies can keep us better prepared for uncertain times.
Let's test some strategies!
We take eight random strategies from our strategy pool and compare them with our SPY buy and hold benchmark. For the backtest period we choose the 2 years from June 2021 to June 2023 where the SPY did very poorly. That's a great test period for our strategies, because if they can outperform the SPY in those challenging times, we have a reasonable chance to outperform the market in a 10 year 'lost decade' scenario like the one Goldman Sachs is potentially seeing ahead of us.
In this period the SPY has done the 'rollercoasting' thing and delivered us an average annual return of 1.77%.

The 8 strategies we are comparing have all different trading rules. They are prototype strategies and are a good starting point, suitable for our exercise. For example strategy 6 is a ‘momentum strategy’ – meaning it aims to catch trends by picking stocks with upward momentum. The strategy description reads like this:
Instead of just buying the SPY and hold it, strategy 6 identifies a short list of stocks within the S&P500 index based on recent price momentum and market conditions. It checks if the market is in an uptrend by comparing short- and long-term moving averages. Every month, the algorithm calculates momentum scores for each stock and buys those with the highest scores if the market is trending up, or shorts those with the lowest scores if the market is trending down. Each position has a trailing stop-loss to limit losses if the prices move in the wrong direction. The strategy holds each position until the next rebalance or until the stop-loss triggers. It uses a mix of stocks to balance risk, adjusting positions based on market trends and each stock’s recent performance.
Our benchmark is the SPY buy and hold strategy. Now let's do our backtest where we simulate how strategies 1 to 8 performed over our test period.
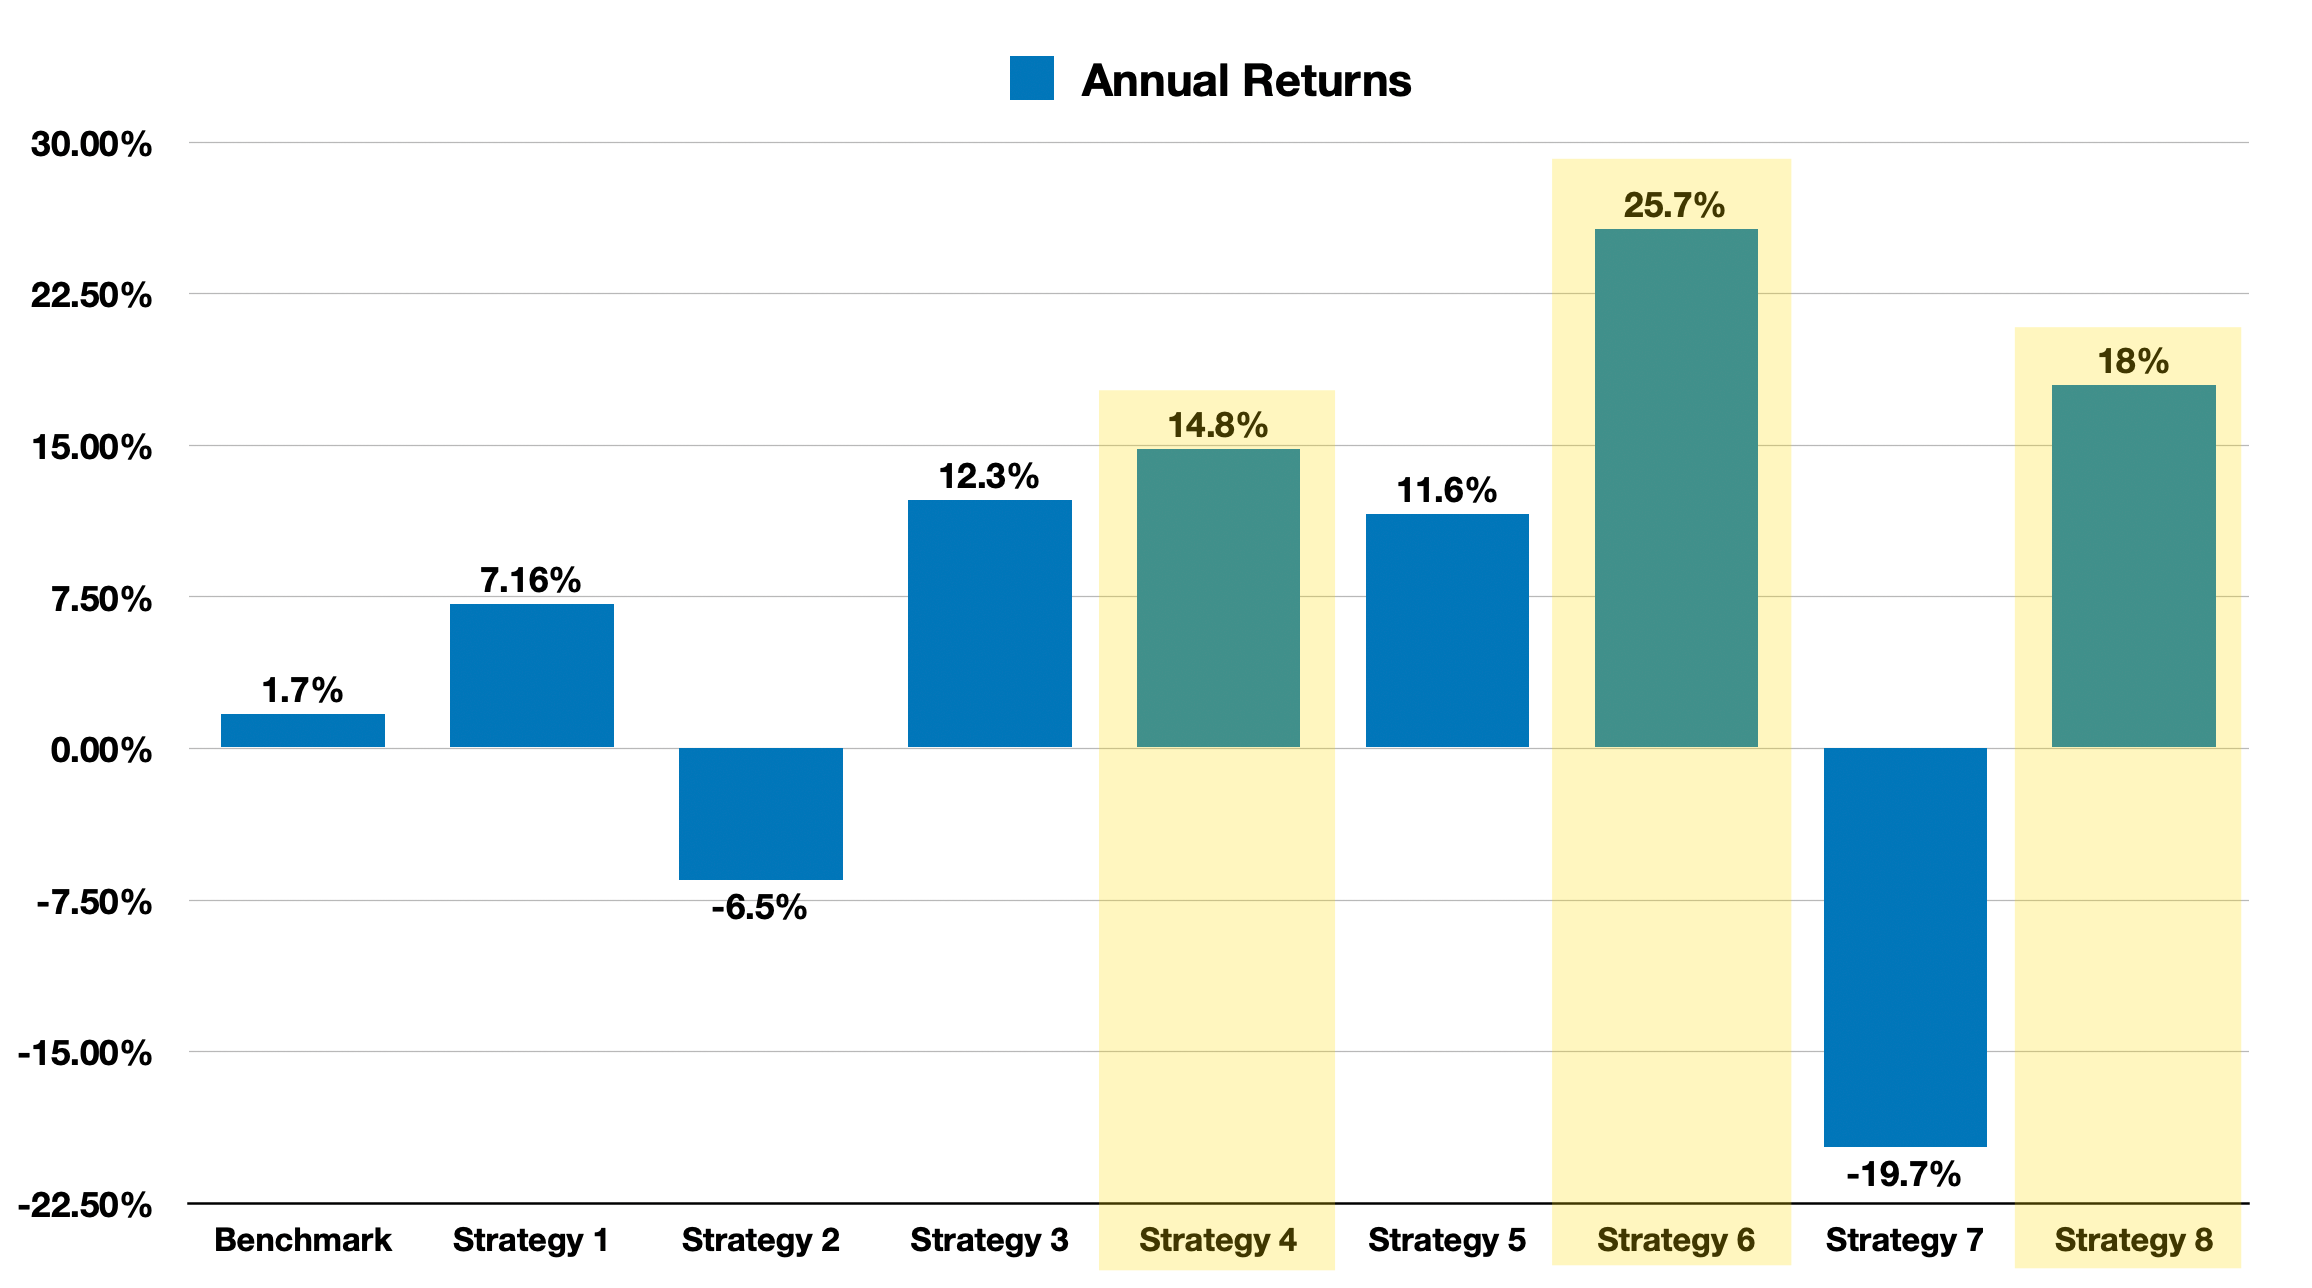
Comparing the returns we can see that 6 out of the 8 strategies performed better than our benchmark. Strategy 6 - our momentum strategy - performed the best.

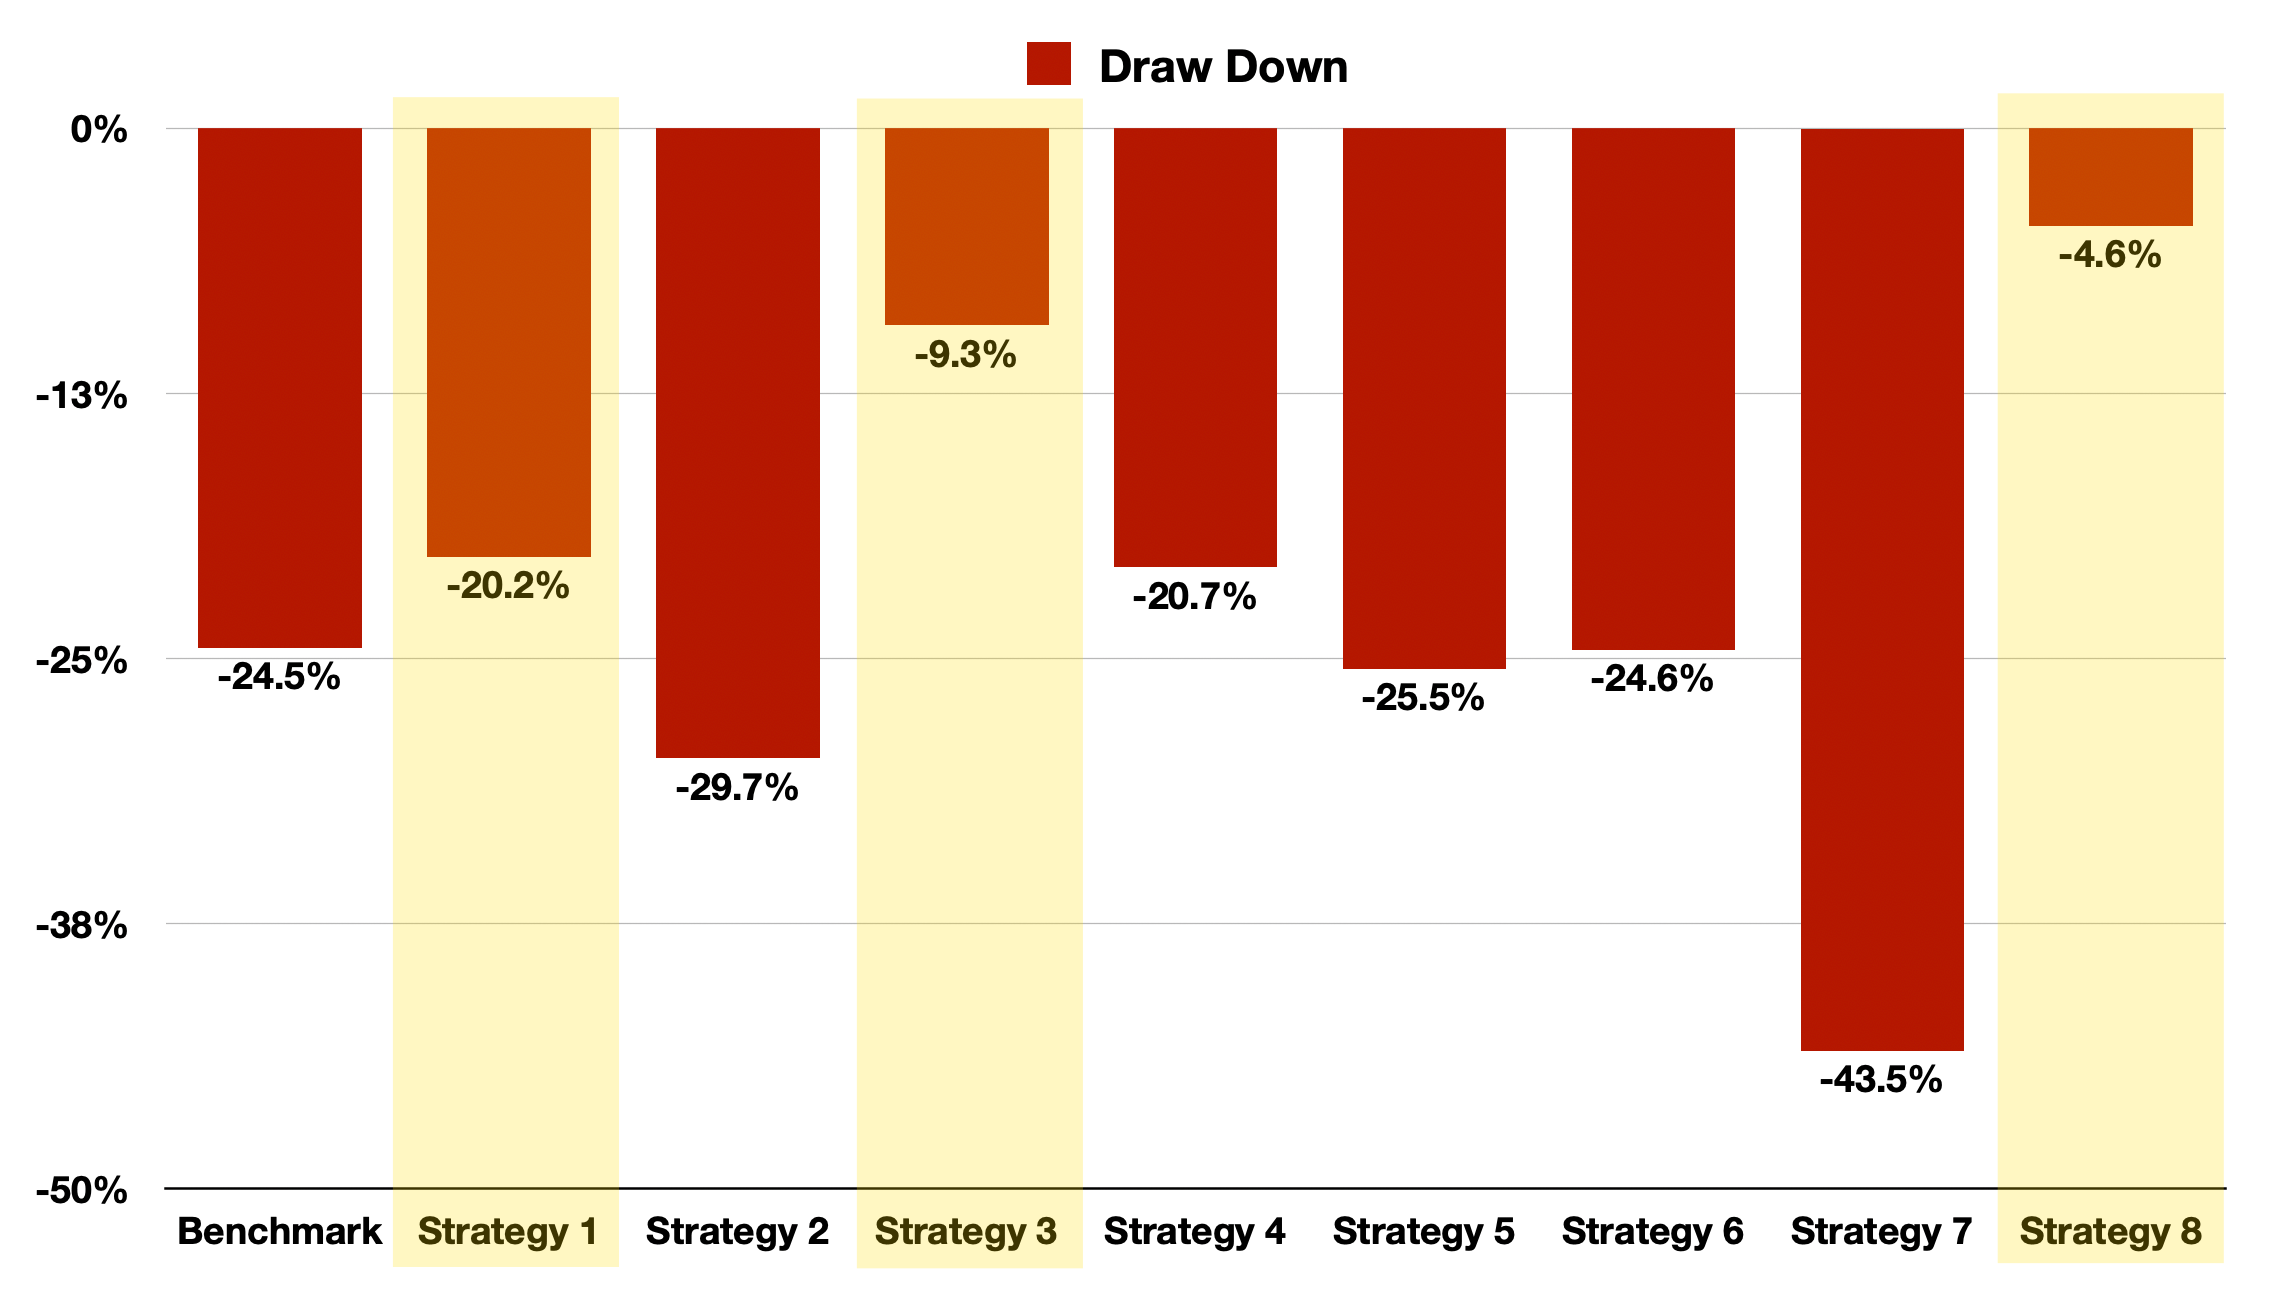
Let's look at the maximum drawdown. This is the maximum % amount you have seen your portfolio value decline in the test period. Ideally we want this value to be as low as possible. In this category the winner is strategy 8 with less than 5% drawdown.

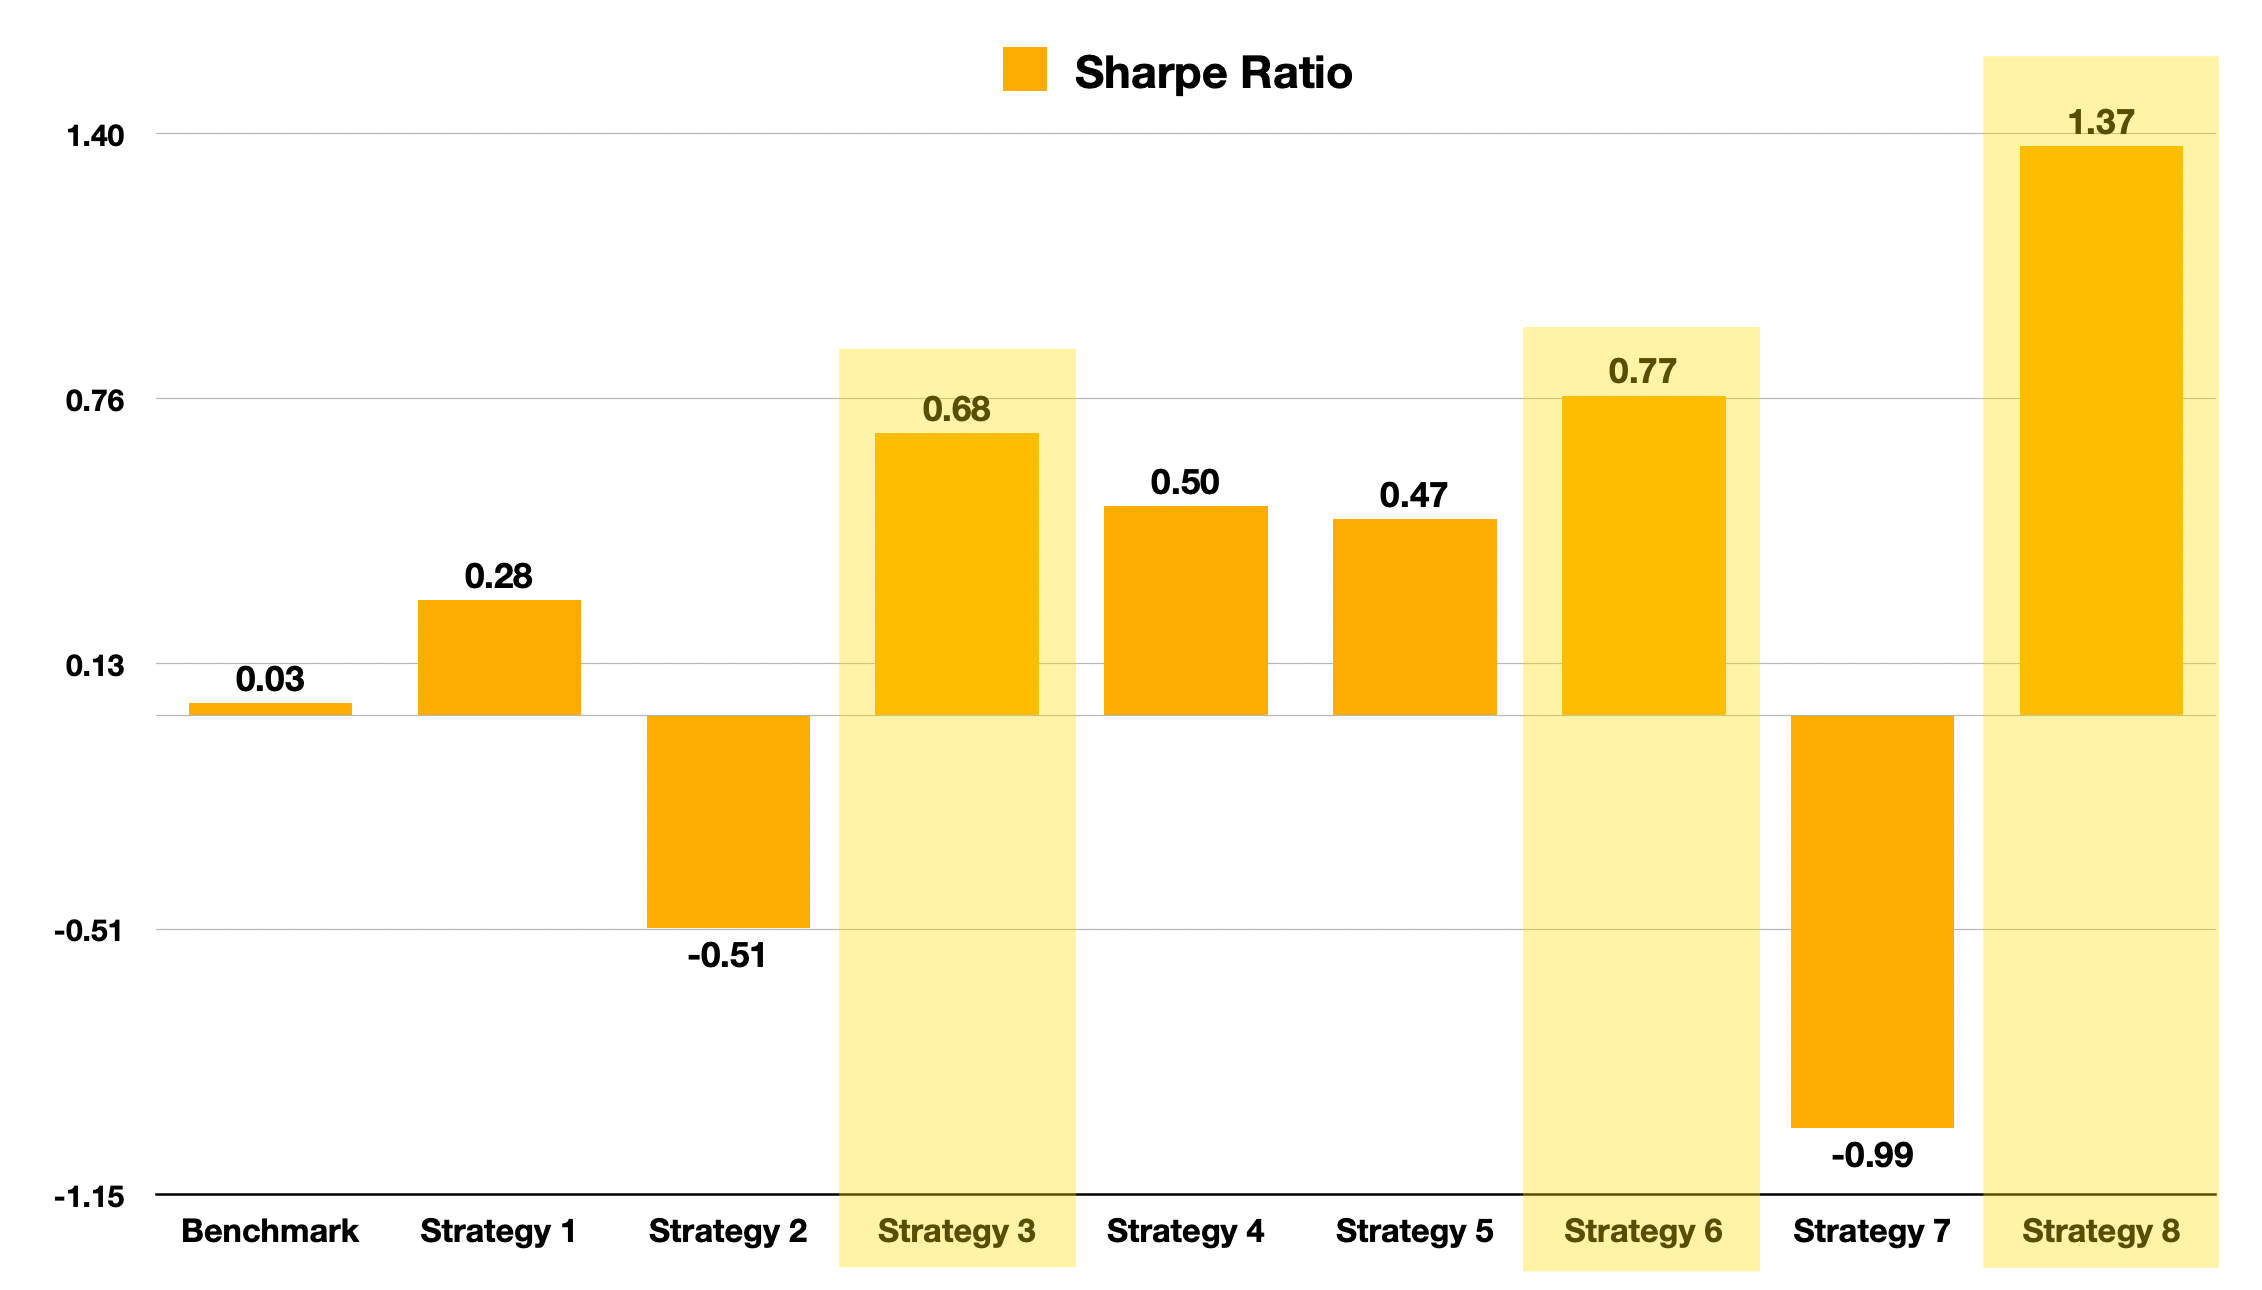
Finally we compare the Sharpe Ratios. Remember, the Sharpe Ratio measures how much return you’re getting for each unit of risk you take with an investment. A higher Sharpe Ratio means better risk-adjusted returns, showing the investment is likely giving more reward for the risk involved. In this category the winner is again strategy 8 with strategy 6 taking second place.

What strategy would you pick? Maybe not just one? Maybe a mix of strategies?
I wanted to take the Goldman Sachs research as an opportunity to encourage you to learn about algorithmic trading strategies and maybe dive deeper into this world. After all you already have one strategy in your arsenal! Remember The Moving Average Strategy? This is a very basic strategy, but a good one to start.
Because when there is a market correction you do not want to simply sell without a plan! Don't make the mistake and miss the best days! We talked about this problem in The 10 Best days post.
Either keep on holding your investment for the long run or have systematic, algorithmic investment strategies or a combination of both. Because you can always have one part of your portfolio as long term buy and hold and another part where you invest according to your algorithmic trading strategies.
If you want to get started - there are plenty of online courses about python and algorithmic trading. Here are a couple of starting points:
Algorithmic Trading Strategies In Python
Python for Finance and Algorithmic Trading with QuantConnect
We use QuantConnect for developing, backtesting and live deployment of algorithmic trading strategies and will help you to get started with this platform in the future. They offer a free account.