66% Annual Return? Really?
Learn how an algorithmic strategy inspired by Benjamin Graham achieved impressive returns by systematically identifying undervalued stocks. This article breaks down the approach and explains the potential rewards and risks involved.

Today, we’re showcasing an algorithmic strategy that impressively turned $10,000 into $200,000 over five years with a 66% annual growth rate. More importantly, it highlights the power of a systematic, data-driven approach that would be nearly impossible to replicate manually.
We understand that this strategy may seem complex at first, especially if you’re new to quantitative investing. But our goal is to introduce its concept and potential. We call it the ‘BG Bargain Hunter,’ named in honor of Benjamin Graham, a pioneer of value investing. Graham’s book, The Intelligent Investor, is often considered one of the foundational works on investing principles. This strategy incorporates some of the guidelines Benjamin Graham set out long ago.
The Foundation of Graham’s Philosophy
Graham’s philosophy focuses on buying stocks undervalued relative to their intrinsic worth. By targeting companies with strong fundamentals but temporarily low prices, investors can reduce risk and boost potential returns as the market normatizes again.
Of course, this method involves detailed balance sheet analysis and financial metrics. Reviewing a company’s financial statements can be tricky and time-consuming.

However, the QuantConnect platform simplifies this process. With access to extensive databases like ‘US Fundamental,’ we can analyze up to 900 data points per company, making the data screening process very simple and efficient. After all, the new version of you is not only good looking but also incredibly smart!

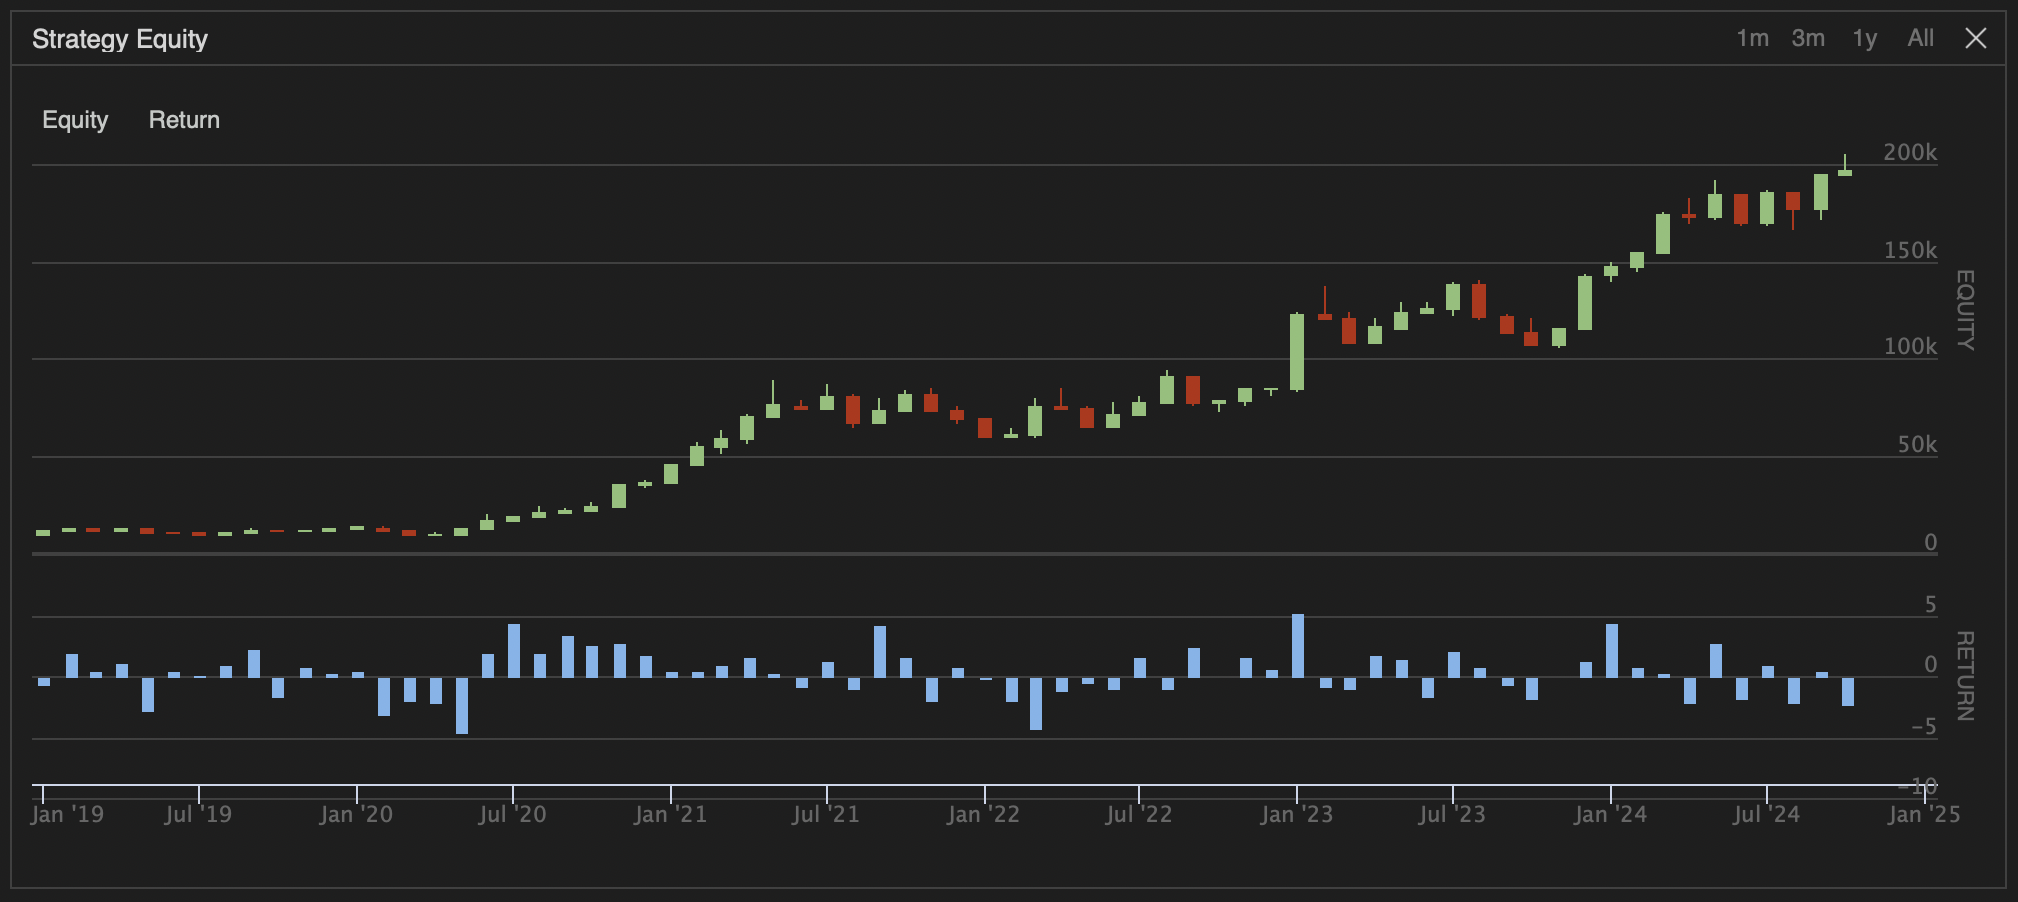
Let's look at the 5 year backtest of the BG Bargain Hunter strategy. This is the plot of the portfolio value over the last 5 years growing from $10,000 to $200,000, representing a 66% annual growth rate.

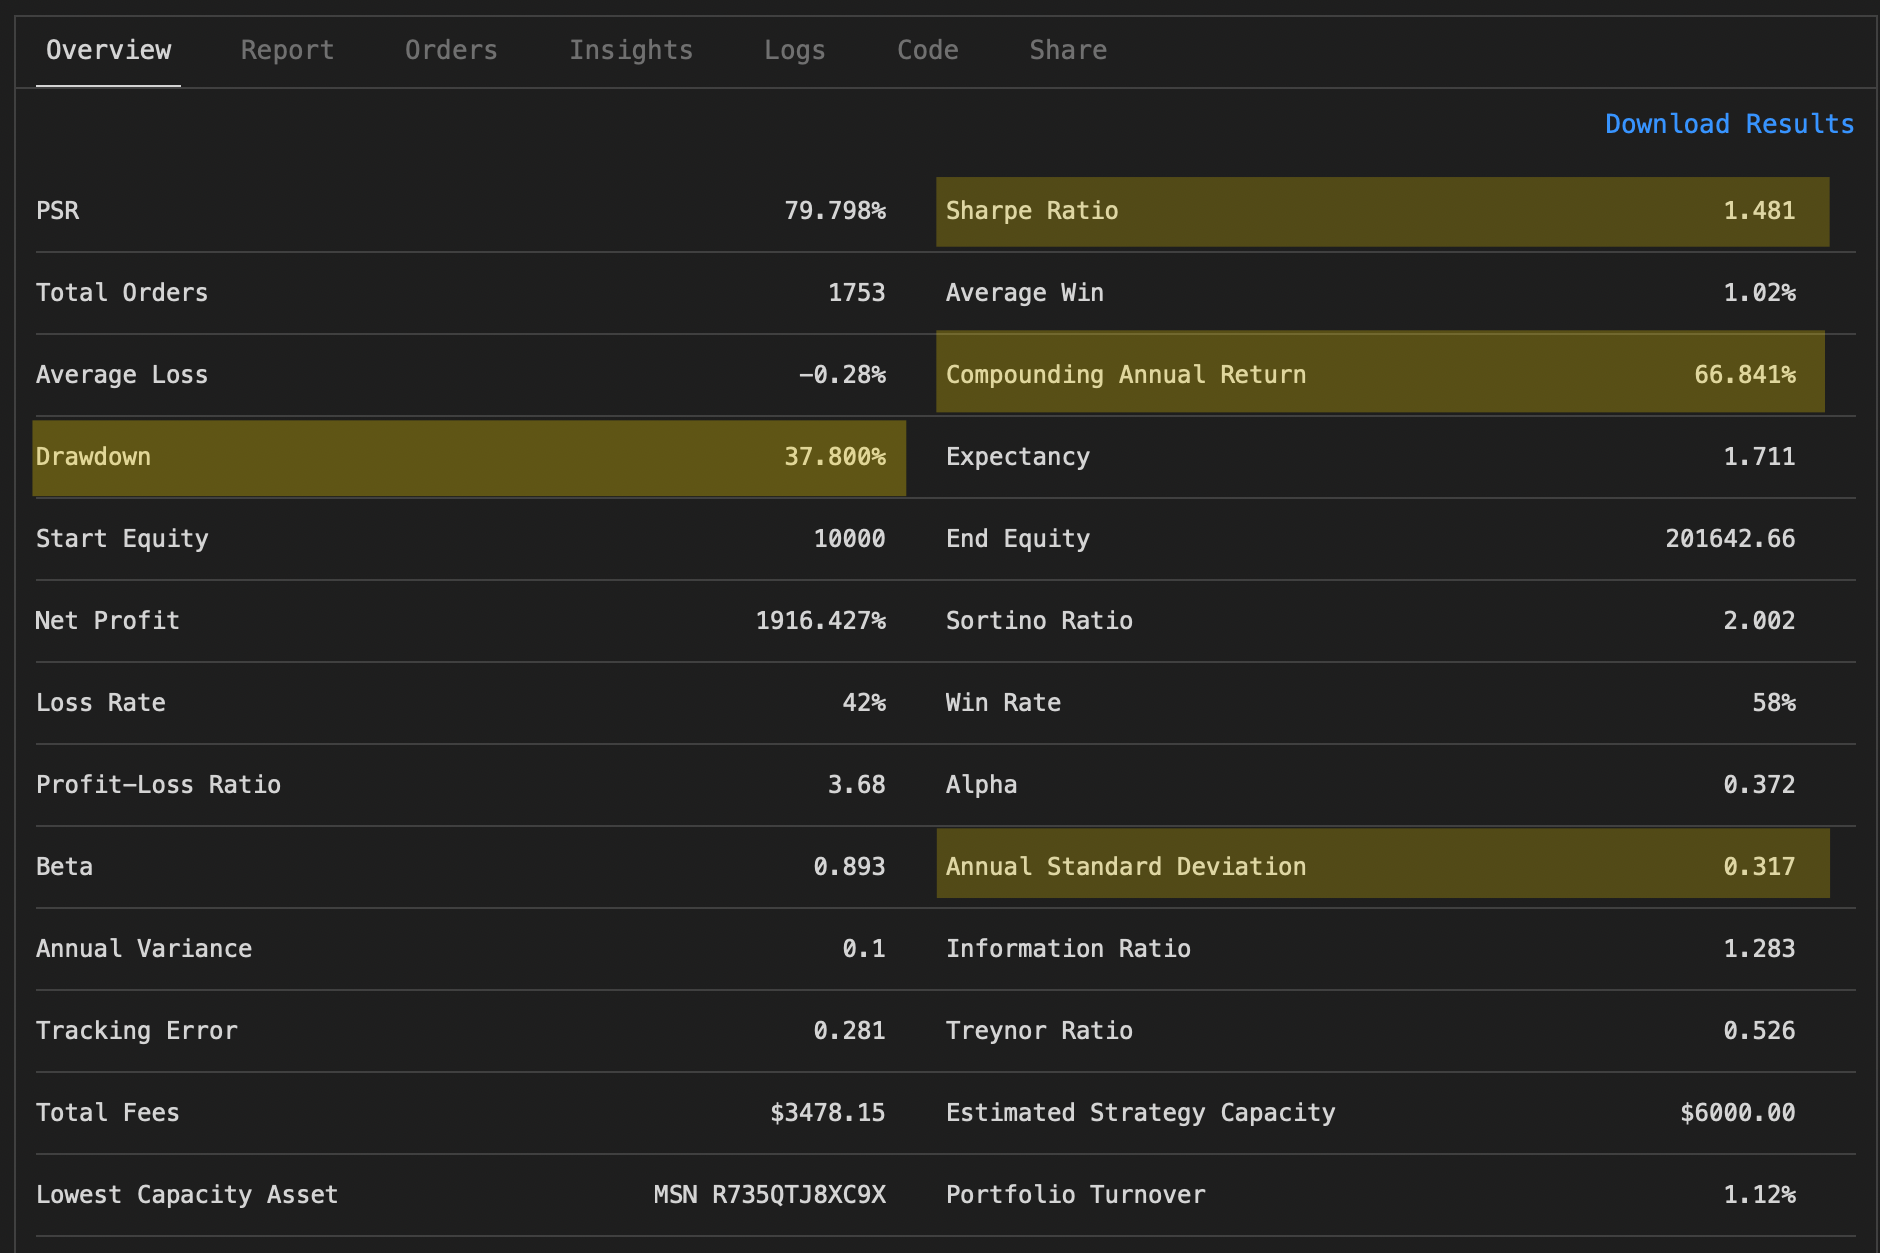
In the future we will dive deeper into these statistics, for now we are just looking at the compounding annual return, the Sharpe ratio, the volatility (Annual Standard Deviation) and drawdown.

While the 66% annual return is impressive, it comes with high risk. A 31.7% volatility level indicates large price swings, and the 37.8% drawdown highlights potential losses. The Sharpe Ratio of 1.48 reflects favorable returns given the risk, but expect a bumpy journey.
The SPY ETF for the same period ...
This BG Bargain Hunter is definitely worth exploring further, but it’s important to understand the limitations of backtesting. Backtesting helps evaluate how a strategy might have performed in the past, providing crucial insights, but it doesn’t guarantee future success. Markets are constantly evolving, so while historical data is useful, it’s just one part of a comprehensive assessment. Without backtesting, however, you’re essentially operating blind. With that in mind, let’s dive deeper into how the BG Bargain Hunter works.
The BG Bargain Hunter
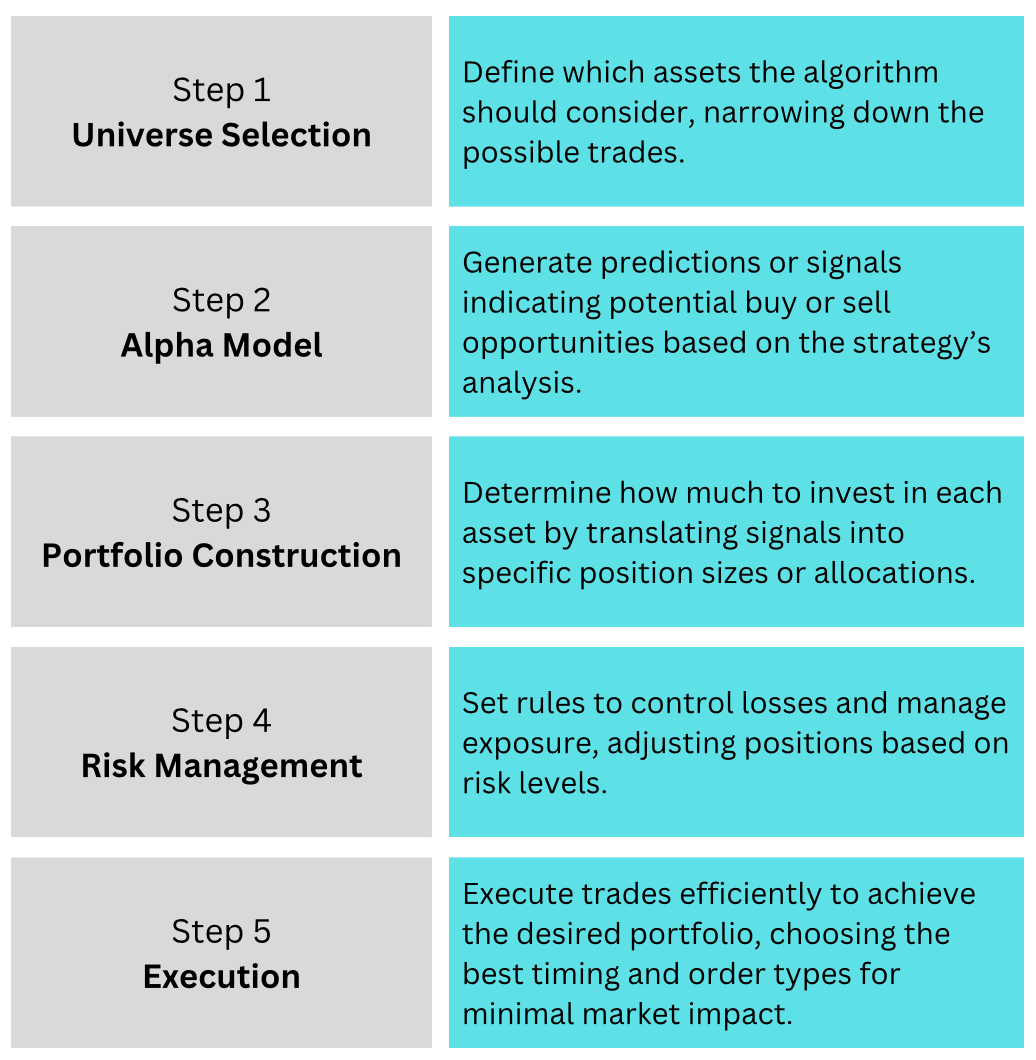
When developing strategies, we need to specify exactly what we want our algorithm to do. To simplify this, we break the process down into five key steps:
Universe Selection:
First, we decide which stocks to consider from all available 30,000 stocks in the database. This narrows our focus to a manageable set of potential trades.
Alpha Model
Next, we determine the conditions for buying and selling. This involves generating signals based on our strategy’s analysis to identify profitable opportunities.
Portfolio Construction
In this step, we decide how to allocate our investments. We specify the number of stocks to hold and the proportion of our capital to invest in each, ensuring a balanced and diversified approach.
Risk Management
This crucial step outlines rules to limit losses and manage exposure. We might set conditions to sell if our investments drop too much or when a certain profit target is reached, keeping our risk under control.
Execution
Finally, we define how to carry out trades efficiently. This involves specifying the best timing and order types to execute buy and sell actions seamlessly, minimizing market impact.

Now let's do exactly this for the BG Bargain Hunter!
Step 1: Choosing Which Stocks to Look At (Universe Selection)
This strategy begins by analyzing 3,000 companies from the QuantConnect ‘US Fundamental Data’ database. We then apply filters to select potential investments based on balance sheet ratios. To identify undervalued stocks, we use the Net Current Asset Value (NCAV) method inspired by Benjamin Graham. NCAV is calculated as working capital (current assets minus current liabilities) times the number of shares outstanding, divided by the company’s market capitalization. If this ratio exceeds 1, the company may be trading below its liquidation value. We look for an even higher margin of safety with a ratio of 1.5, indicating that the company’s net current assets are 1.5 times its market capitalization, suggesting significant undervaluation and aligning with conservative investing principles.
Additionally, we exclude the financial sector to avoid balance sheet complexities and apply filters for trading liquidity and market capitalization. We focus only on companies with a small market capitalization and sufficient trading liquidity to ensure that stocks can be efficiently bought and sold without impacting prices.
These are some tough criteria and out of the 3,000 stocks there are sometimes only 20-80 companies who pass this test.
Step 2: Deciding When to Buy or Sell (Alpha Model)
To determine the right time to invest, the strategy uses a “regime filter” based on the performance of the S&P 500 index (SPY). This filter helps decide whether we are in a market uptrend or downtrend using two simple moving averages: a 100-day and a 200-day average. When the shorter 100-day moving average crosses below the longer 200-day moving average, it signals potential market weakness. In this case, the strategy switches to a safer investment by allocating funds to gold (GLD) instead of stocks. Conversely, if the 100-day moving average rises above the 200-day moving average, it indicates a strengthening market, prompting the strategy to stop investing in gold and shift back to equities.
Step 3: Deciding How Much to Invest and in Which Stocks (Portfolio Construction)
Once we know which stocks are potentially undervalued and when to invest, the next step is to construct our portfolio. The strategy equally divides the investment across all selected stocks that meet the NCAV and liquidity criteria. This diversification helps spread out risk and ensures no single stock has too much influence over the portfolio’s performance. To amplify returns, the strategy uses a leverage of 1.5, meaning we invest 1.5 times our available capital. By equally weighting the positions and applying leverage, the strategy aims to enhance potential returns while maintaining a balanced and risk-managed approach.
Step 4: Managing Risks (Risk Management)
Risk management is crucial to protect the portfolio from significant losses. In this strategy, risk is managed by limiting exposure to individual stocks through equal weighting and using a regime filter to reduce market exposure during downturns. Additionally, the strategy may include rules to liquidate positions if market conditions change drastically or if stop-loss thresholds are met. By having these safeguards, the strategy aims to preserve capital and ensure the portfolio remains resilient in different market environments.
Step 5: Making Trades (Execution)
The strategy follows a disciplined execution plan by rebalancing the portfolio every three months (January, April, July, and October). This quarterly schedule ensures that buying and selling decisions are consistent and systematic, avoiding the emotional pitfalls of market timing. At each rebalancing, all existing positions are sold, and new positions are selected based on the latest NCAV and liquidity criteria. The algorithm then places buy and sell orders with the broker to adjust holdings as necessary, based on the selection of the Alpha Model.
Conclusion
The impressive annual growth rates of 66%—turning $10,000 into hundreds of thousands of dollars over just a few years—demonstrate the incredible potential of systematic, data-driven investing on a platform like QuantConnect. The BG Bargain Hunter executes 58,250 precise calculations every quarter to determine which stocks to buy. Achieving this level of analysis manually would be almost impossible—or, at the very least, incredibly exhausting.
However, it’s crucial to remember that past performance does not guarantee future success. Markets are always evolving, and while backtesting provides valuable insights, it is just one component of a comprehensive evaluation process.
If you’d like to dive deeper into the principles behind this strategy, Benjamin Graham’s The Intelligent Investor is an excellent resource. For a quick overview, this video does a great job summarizing the key concepts from the book.